python绘制一个地点周围的设施分布
百度开放地图的使用
这个在网上都可以搜索到,需要使用开发者模式。
百度地图开放平台
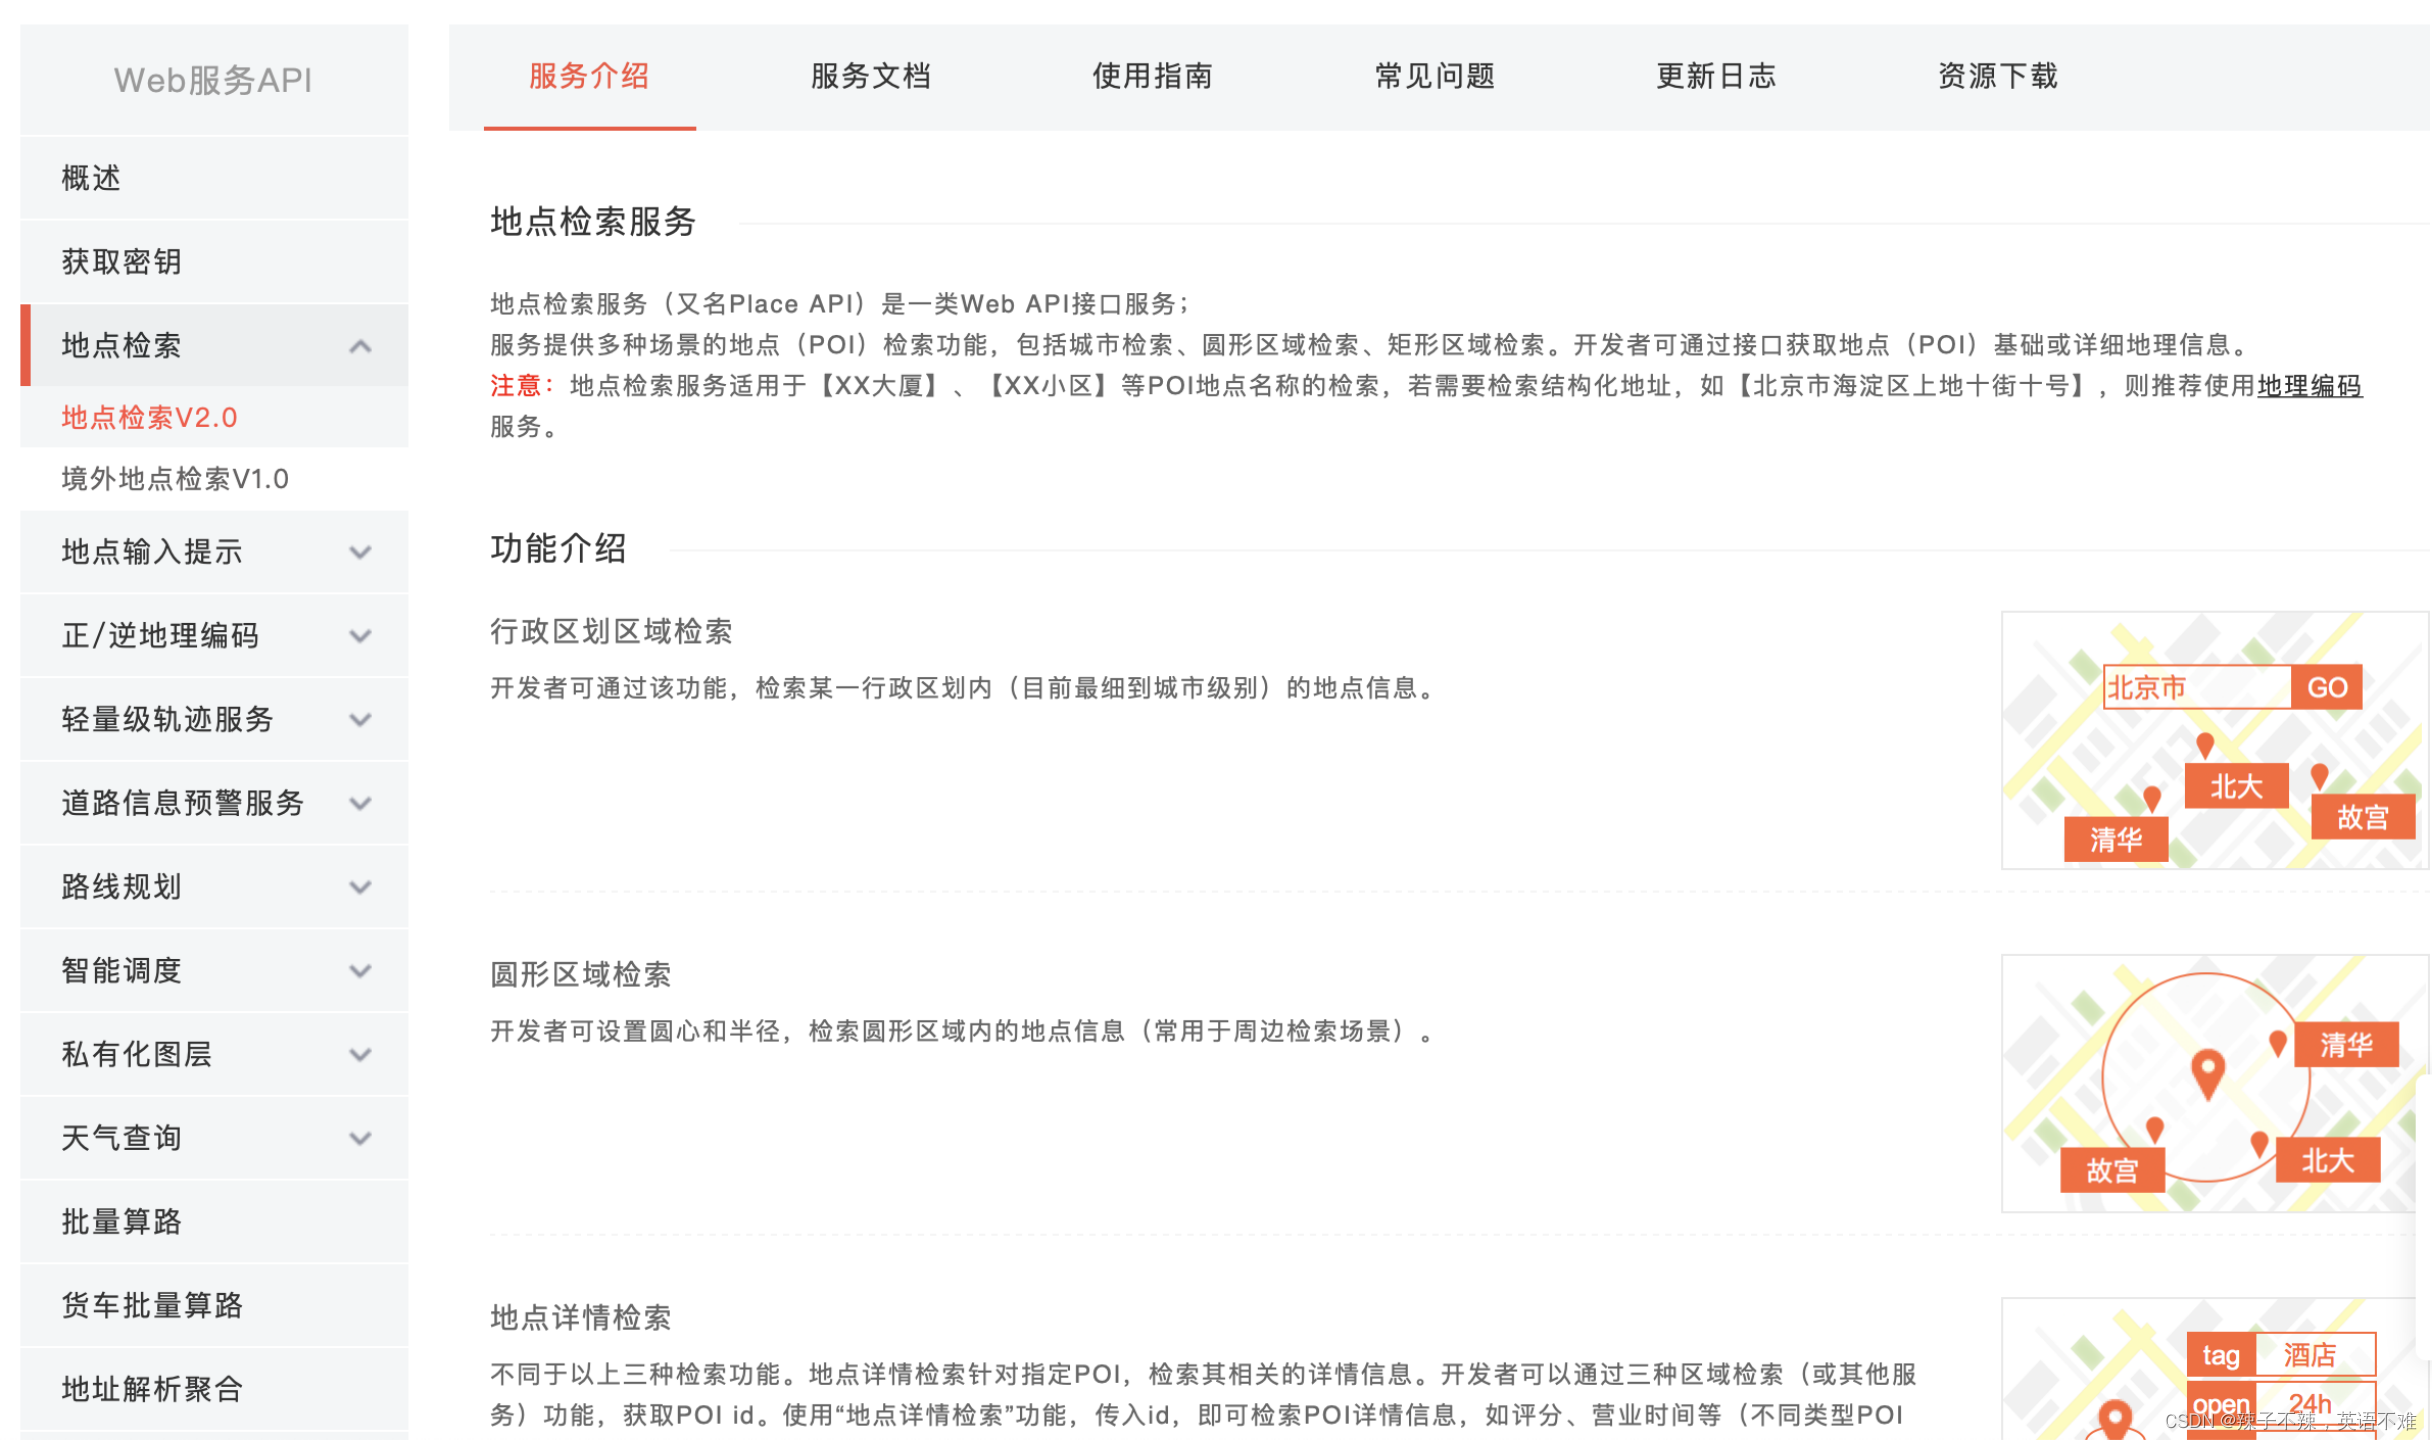
这个需要密钥ak 在成为开发者模式后可以申请。免费爬取3000条一天
https://xxxxxxx?query=银行&location=39.915,116.404&radius=2000&output=xml&ak=您的密钥
网站使用参数说明
- query:如果需要按POI分类进行检索,请将分类通过query参数进行设置,如query=美食
- location:圆形区域检索中心点,不支持多个点
- radius:圆形区域检索半径,单位为米。
- output:输出格式为json或者xml
爬出来的网页样式(json)
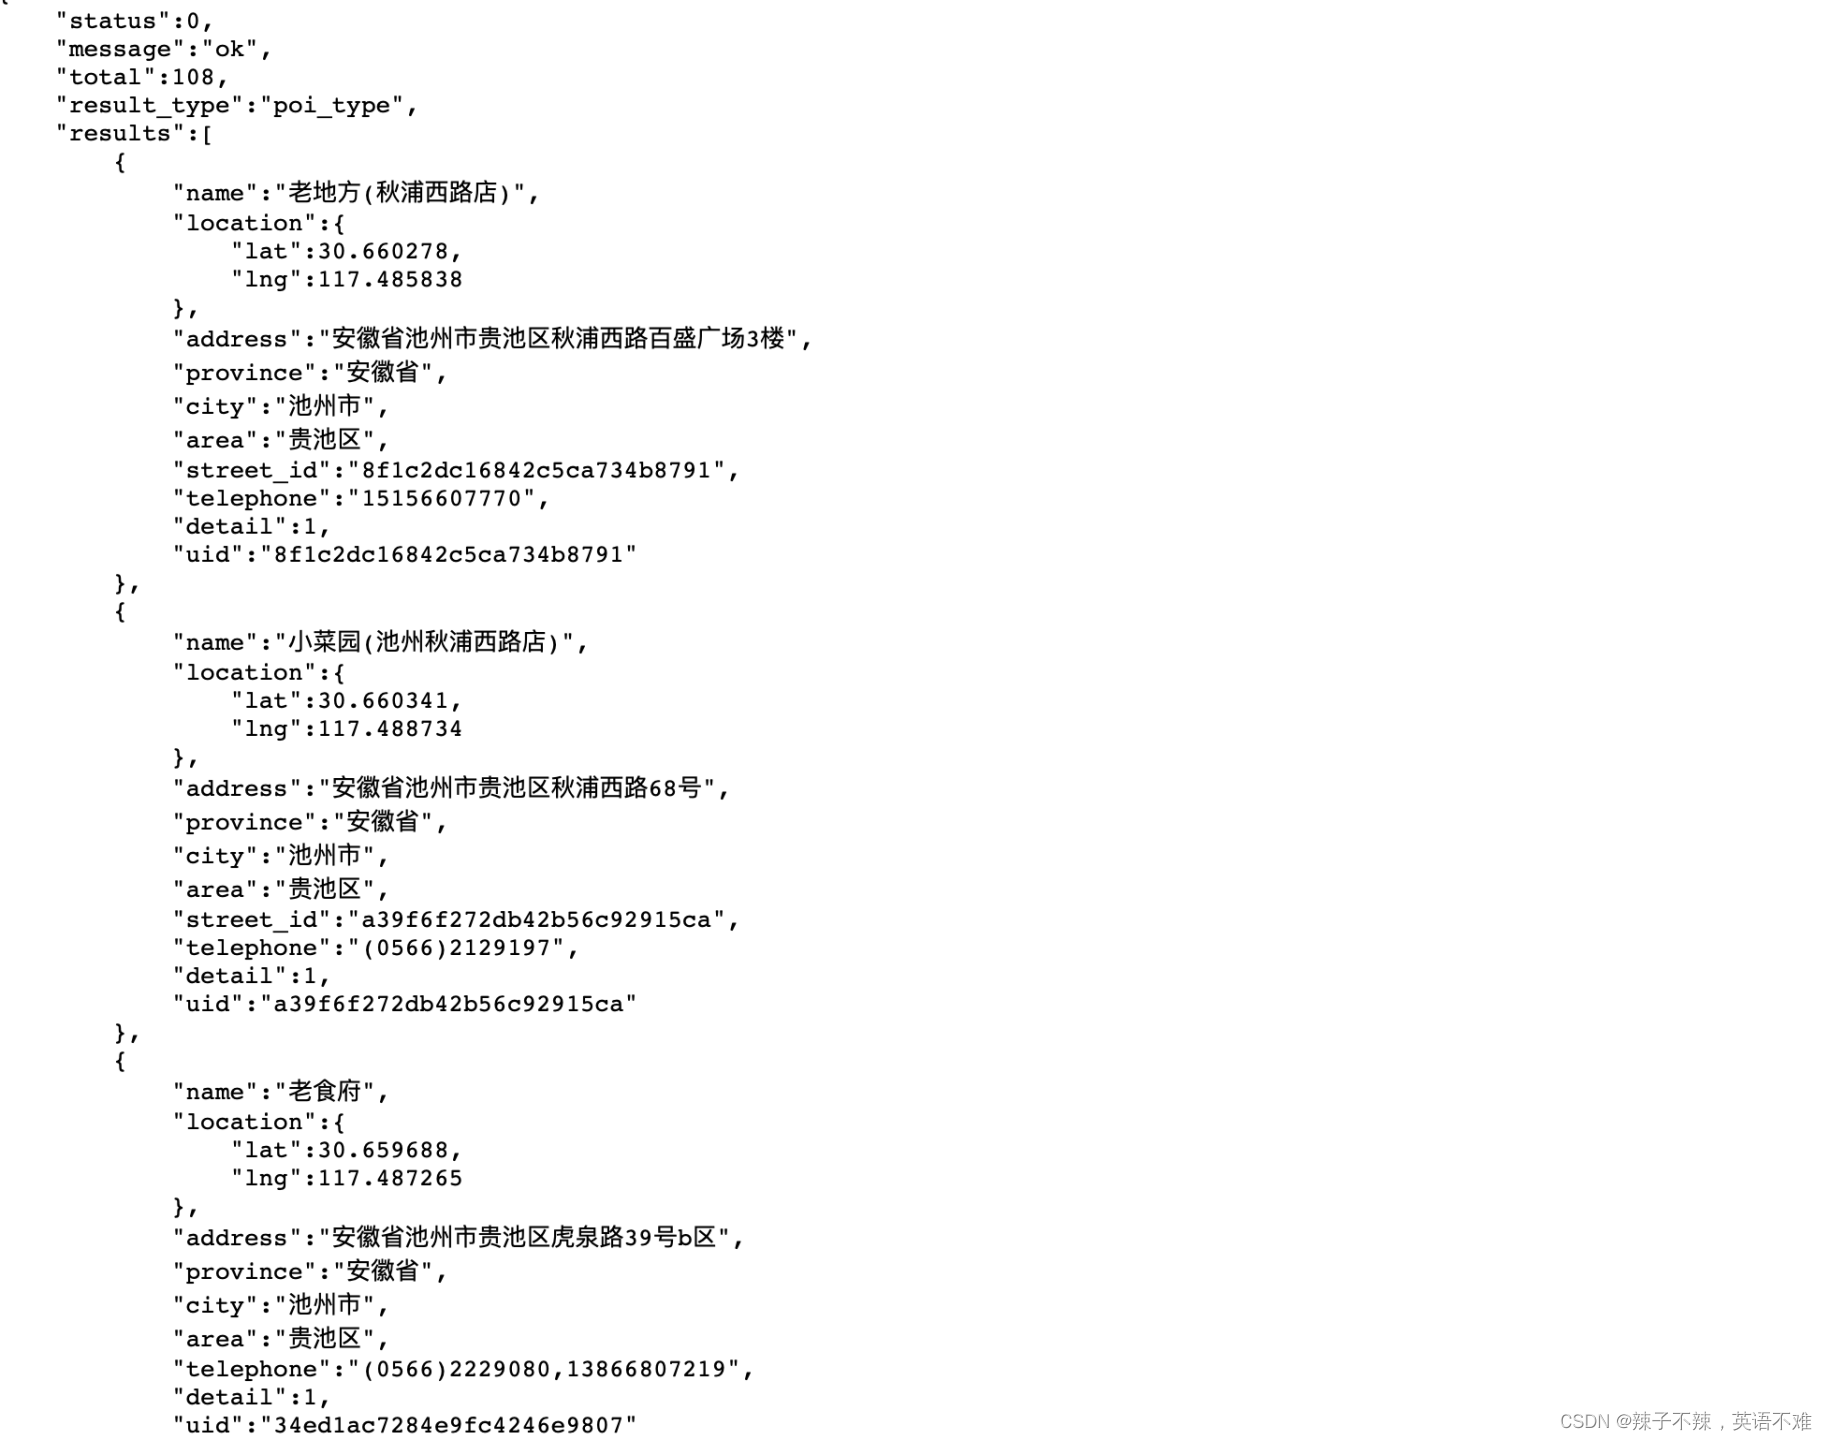
name:店铺名字
location: 百度地图经纬度坐标
total: 1km范围内的所有的美食店铺
telephon: 店铺电话
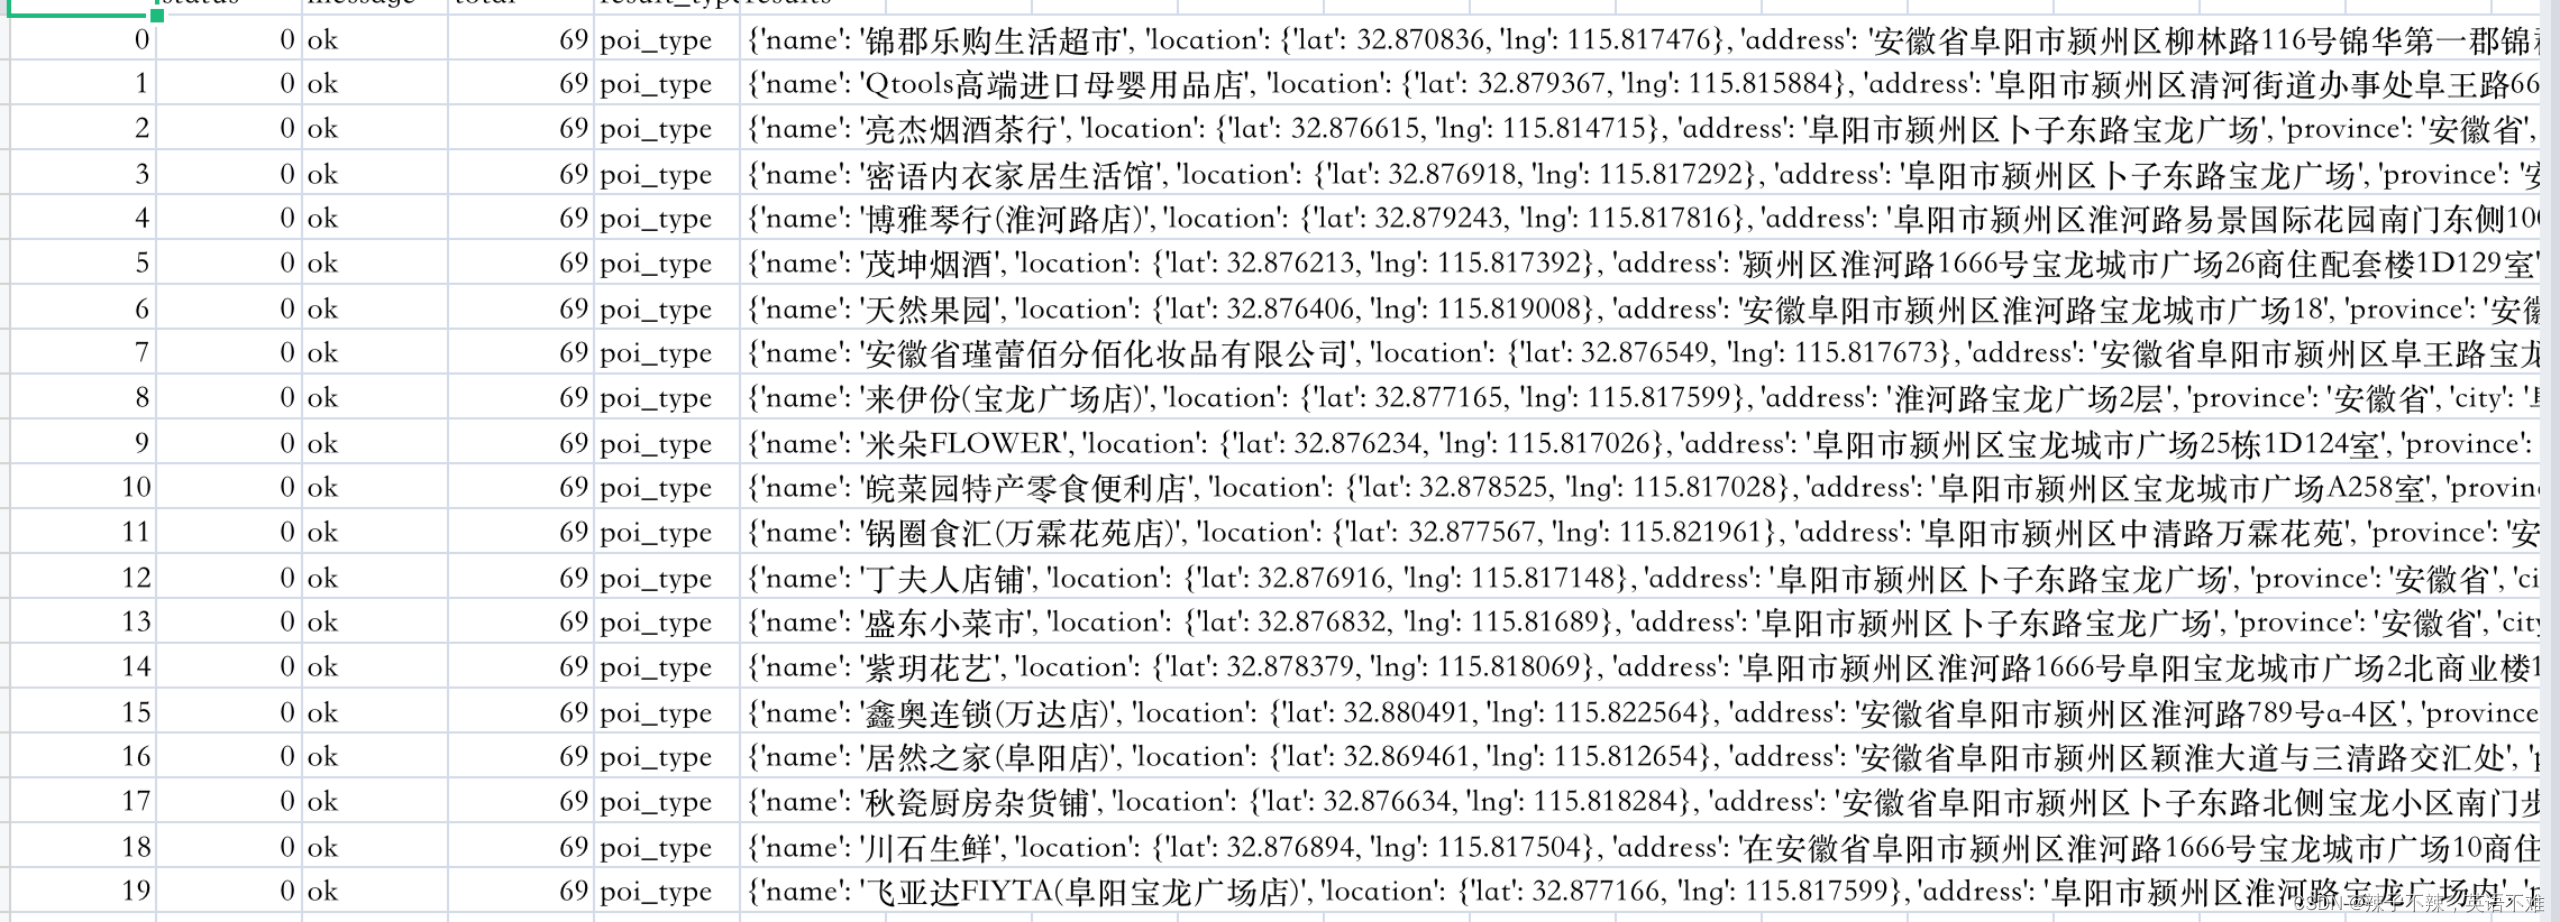
保存数据
将爬取出来的数据(坐标点)在地图上呈现出来
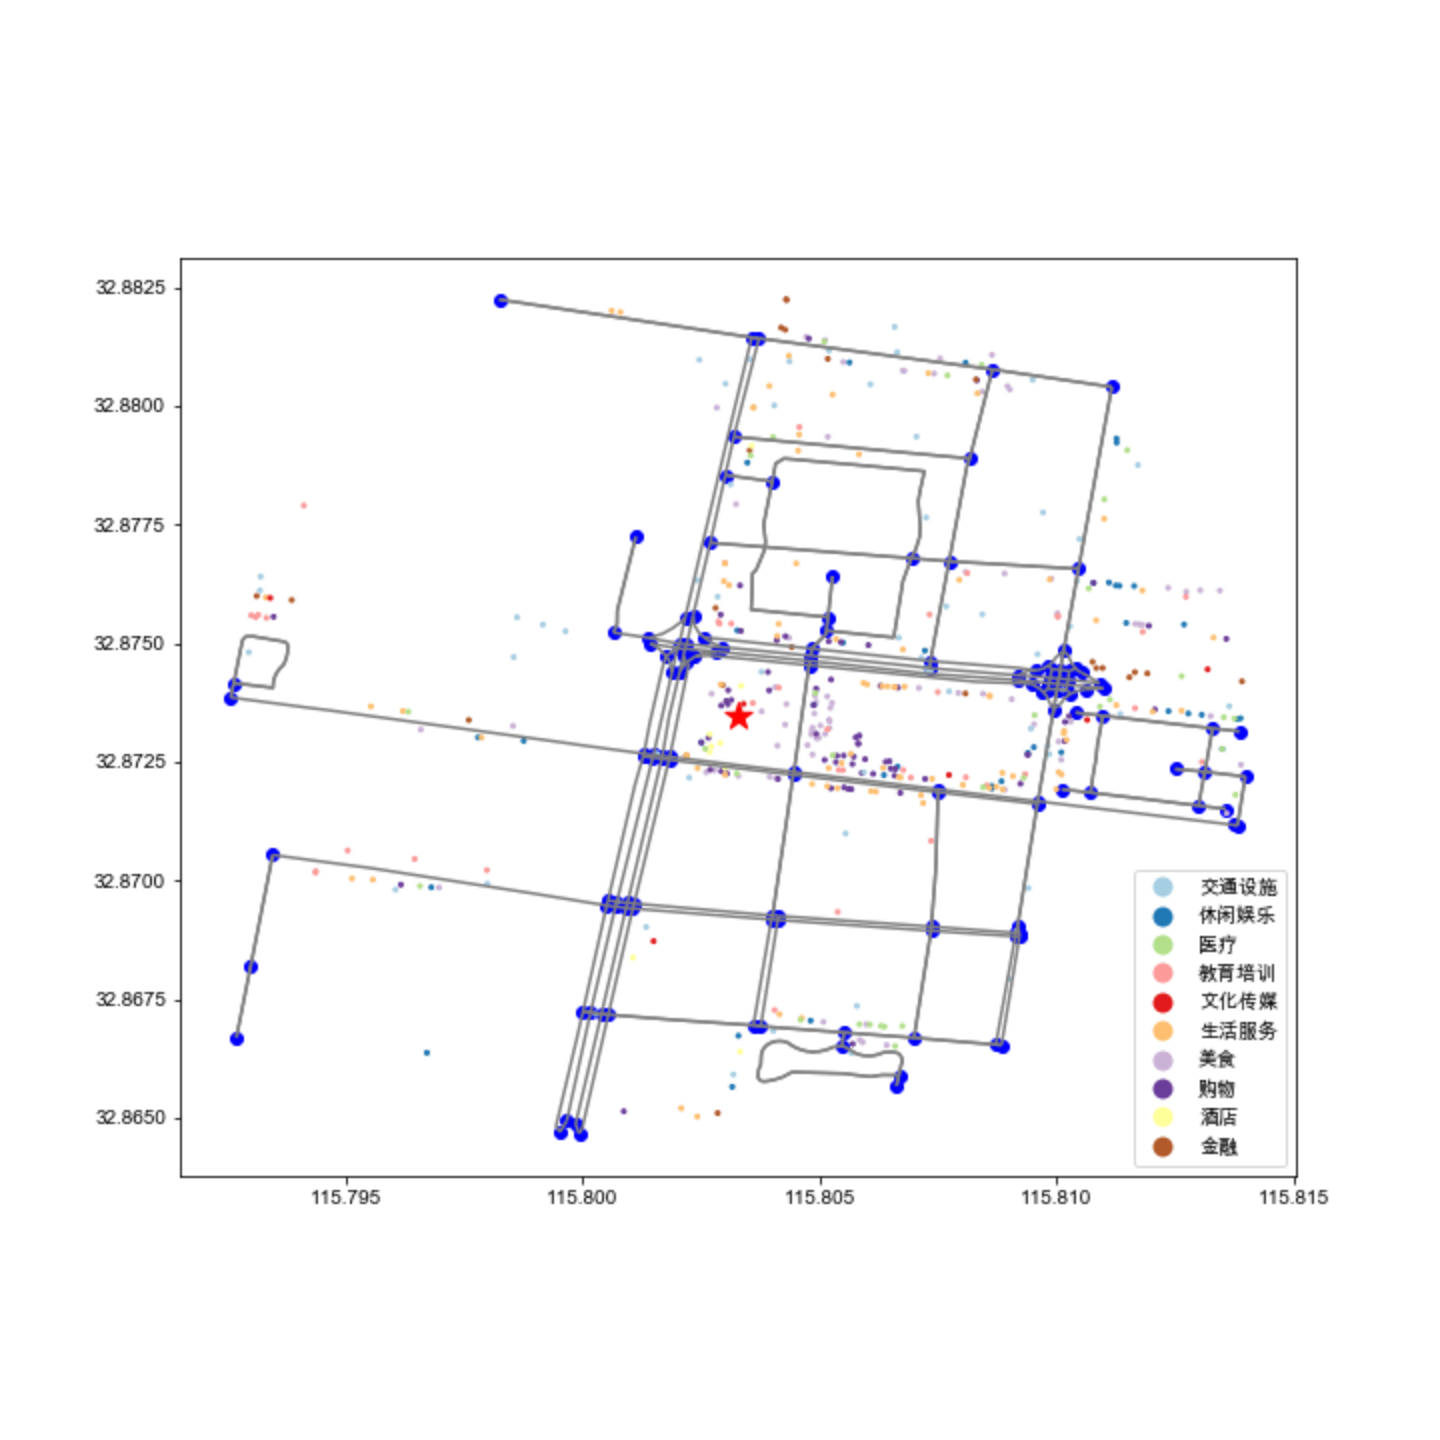
使用了 osmnx 与 geopandas两个重要的包
部分核心代码
G = ox.graph_from_point(center_point=(location[1],location[0]),dist=1000,network_type='drive')
G_gdf = ox.graph_to_gdfs(G)
base = G_gdf[1].plot(figsize=(10,10),edgecolor='grey')
G_gdf[0].plot(ax=base,color='blue')
kuanzhai.plot(marker='*',ax=base,color='red',markersize=300)
west,east = base.get_xlim()   ### 这里获取一下底图的东西南北边界,为下一步爬取边界内的POI做准备
south,north = base.get_ylim()
查看周围的设施占比
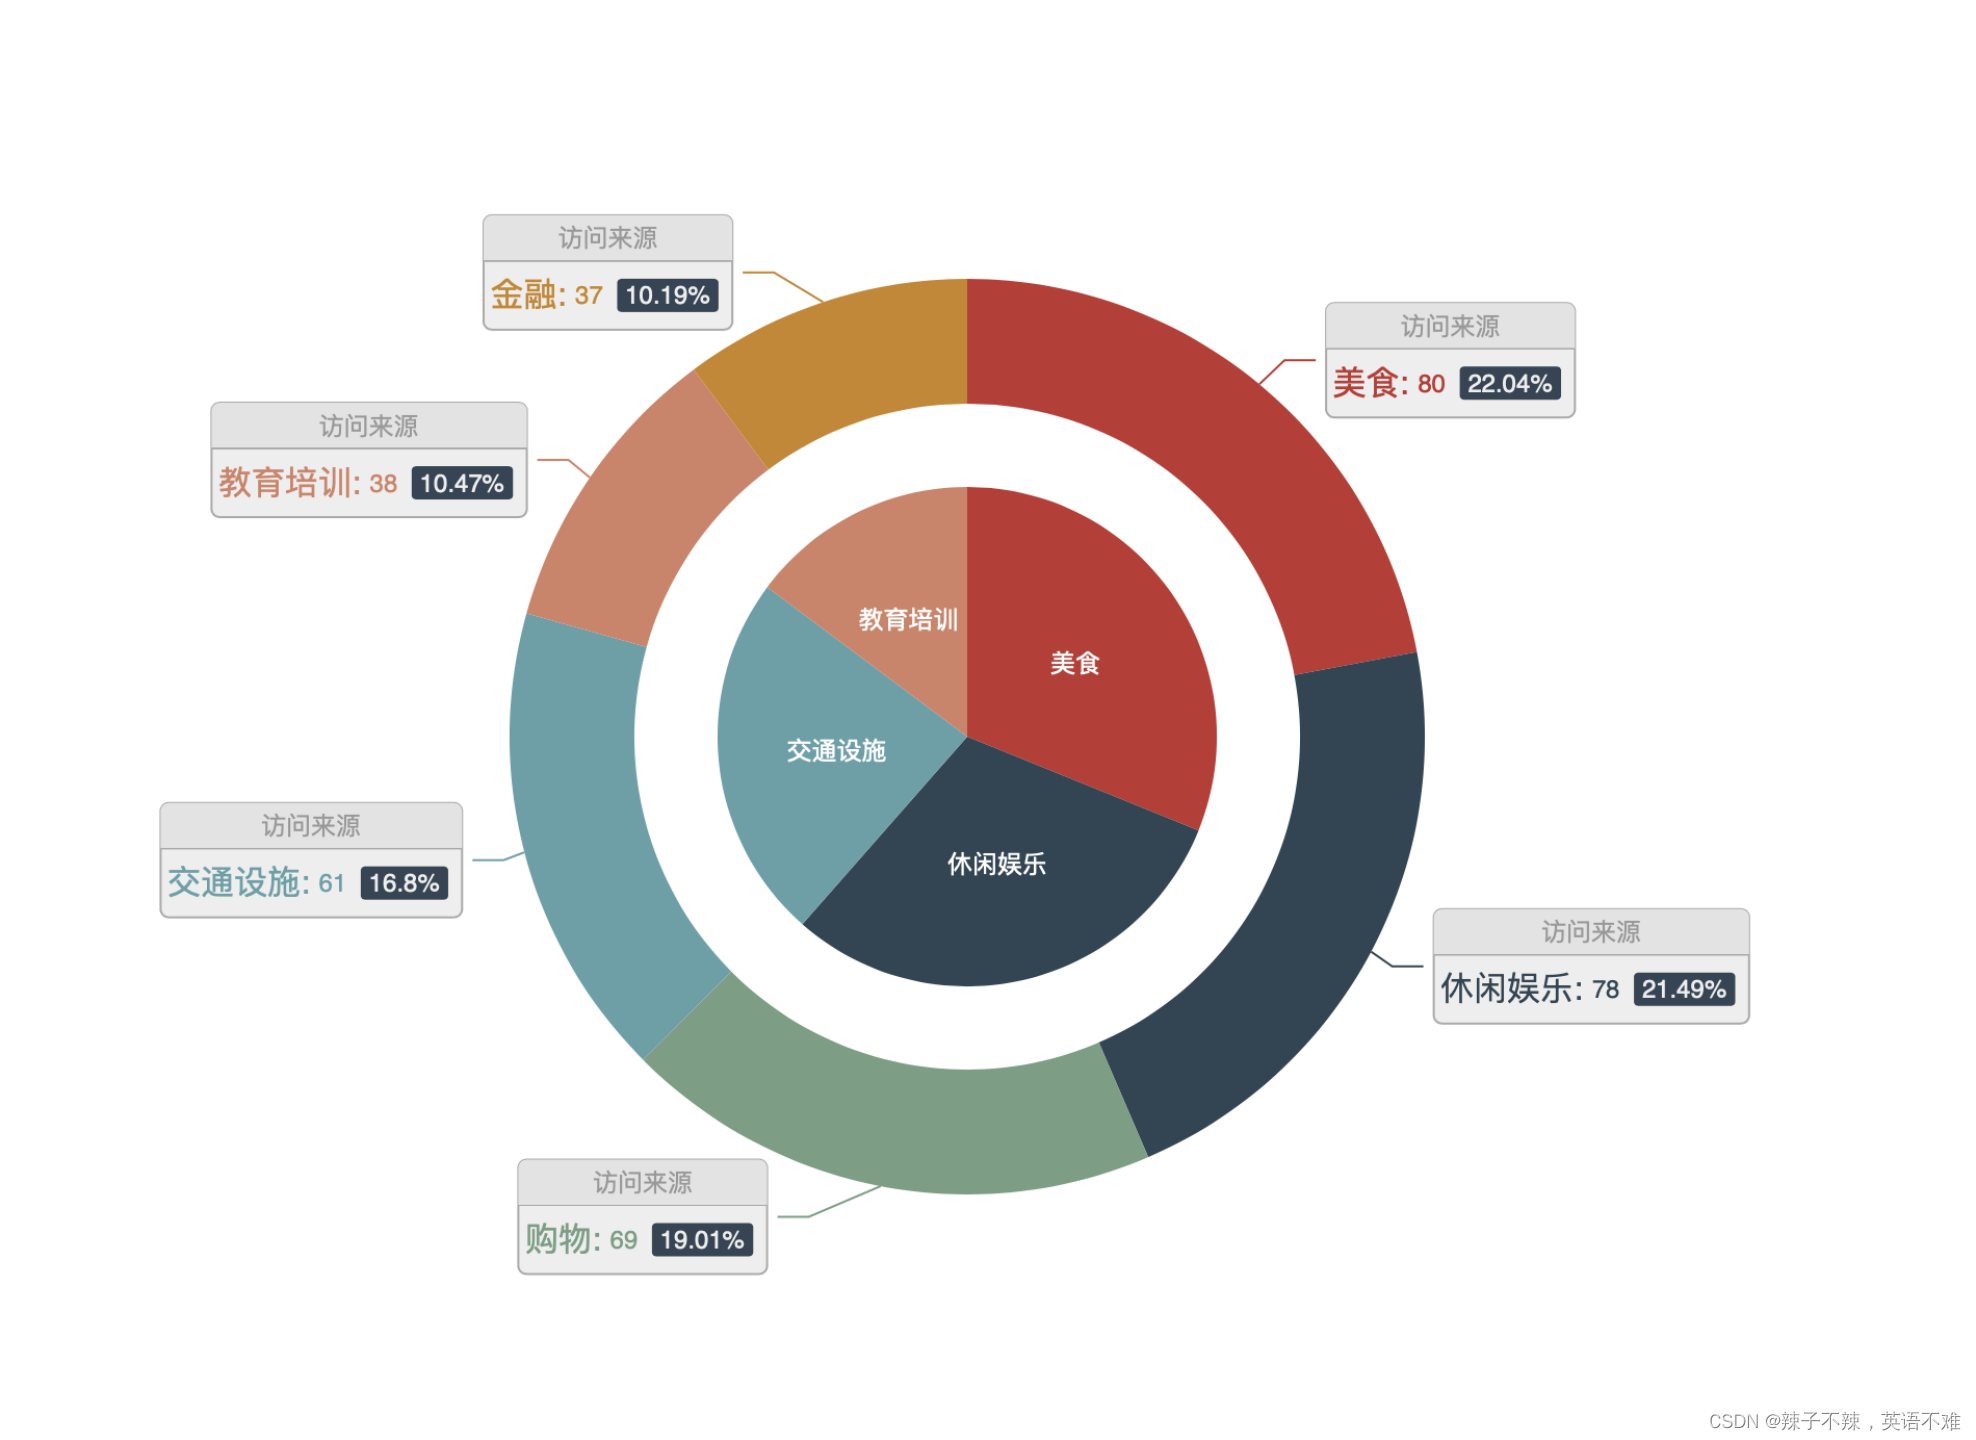
def pie_chart() -> Pie:
    pie = (
        Pie(init_opts=opts.InitOpts(width="1600px", height="800px"))
        .add(
        series_name="访问来源",
        data_pair=inner_data_pair,
        radius=[0, "30%"],
        label_opts=opts.LabelOpts(position="inner"),
        )
        .add(
        series_name="访问来源",
        radius=["40%", "55%"],
        data_pair=outer_data_pair,
        label_opts=opts.LabelOpts(
            position="outside",
            formatter="{a|{a}}{abg|}\n{hr|}\n {b|{b}: }{c}  {per|{d}%}  ",
            background_color="#eee",
            border_color="#aaa",
            border_width=1,
            border_radius=4,
            rich={
                "a": {"color": "#999", "lineHeight": 22, "align": "center"},
                "abg": {
                    "backgroundColor": "#e3e3e3",
                    "width": "100%",
                    "align": "right",
                    "height": 22,
                    "borderRadius": [4, 4, 0, 0],
                },
                "hr": {
                    "borderColor": "#aaa",
                    "width": "100%",
                    "borderWidth": 0.5,
                    "height": 0,
                },
                "b": {"fontSize": 16, "lineHeight": 33},
                "per": {
                    "color": "#eee",
                    "backgroundColor": "#334455",
                    "padding": [2, 4],
                    "borderRadius": 2,
                },
            },
        ),
    )
        .set_global_opts(legend_opts=opts.LegendOpts(pos_left="left", orient="vertical"))
        .set_series_opts(
            tooltip_opts=opts.TooltipOpts(
                trigger="item", formatter="{a} <br/>{b}: {c} ({d}%)"
        )
    )
    )
    return pie
pie_chart().render("图片的输出/{}_render.html".format(address))
绘制的核密度图(购物部分)
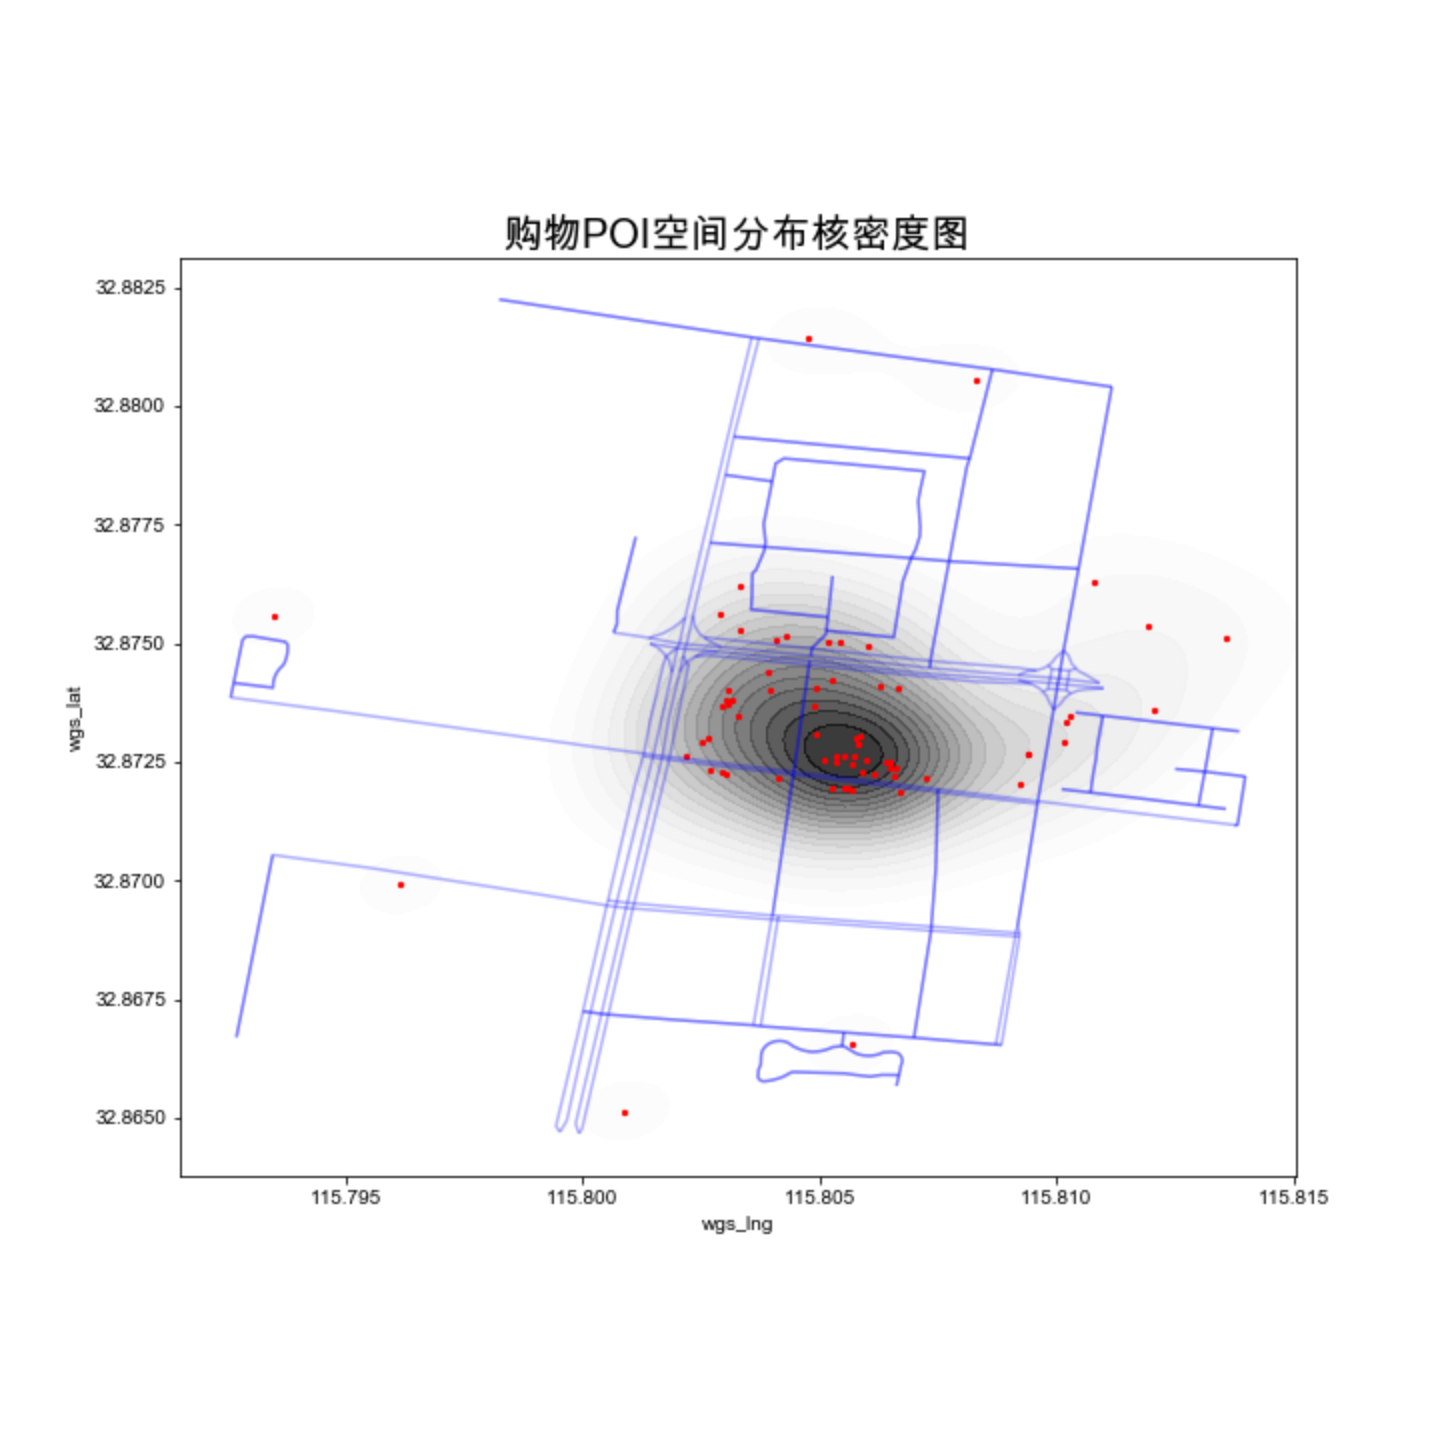
    meishi = datas[datas['category']=='{}'.format(i)]
    base = G_gdf[1].plot(figsize=(10,10),edgecolor='blue',alpha=0.3)
    sns.kdeplot(meishi['wgs_lng'],meishi['wgs_lat'],shade=True,shade_lowest=False,cmap='Greys',n_levels=20,alpha=0.8,legend=False)
    meishi.plot(ax=base,color='red',markersize=5)
    #kuanzhai.plot(marker='*',ax=base,color='red',markersize=200)
    plt.xlim(west,east)
    plt.ylim(south,north)
    plt.title('{}POI空间分布核密度图'.format(i),fontsize=20)
    plt.savefig('核密度图/{}_{}POI空间分布核密度图'.format(address,i))
    plt.show()
结尾
如果喜欢还请多多支持,点赞加关注哟~~